
How Competitor Data Reveals Viral Patterns
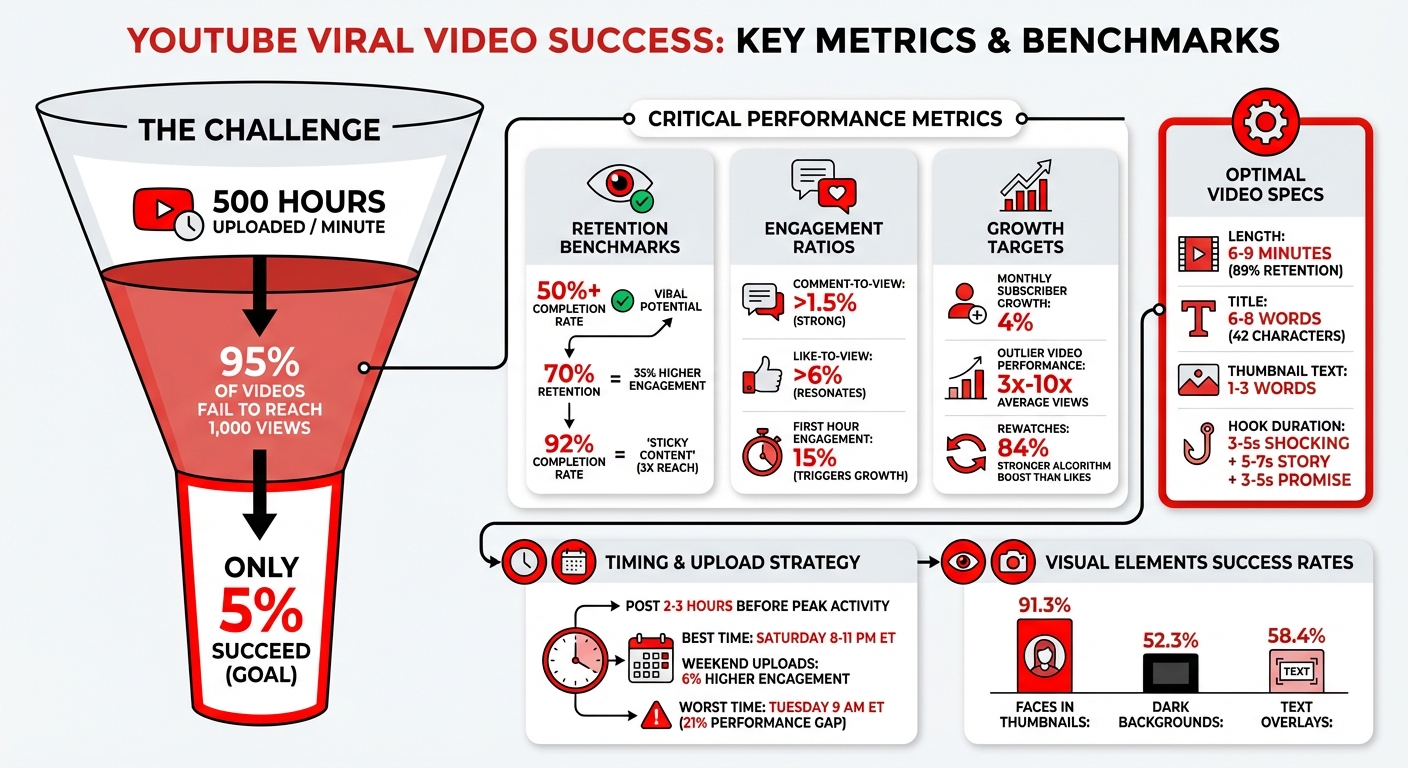
YouTube is flooded with over 500 hours of video uploads every minute, yet 95% of those videos fail to reach 1,000 views. What separates the top 5%? It’s not luck - it’s data-driven strategies. By analyzing competitor content, you can identify patterns that make videos go viral and apply those insights to your own channel. Here's how:
- Study Competitor Channels: Focus on 5–7 channels in your niche, including direct competitors and aspirational creators. Use tools like YouTube Studio to identify trends among their top-performing videos.
- Track Key Metrics: Look beyond subscriber counts. Analyze average views per video, engagement ratios (e.g., likes and comments), and standout videos with 3–10x the usual performance.
- Spot Viral Patterns: High-performing videos often use specific formats like "Hidden Problem" themes or "Myth Buster" titles. Short, structured videos (6–9 minutes) with strong hooks and retention strategies consistently perform better.
- Perfect Timing: Post videos 2–3 hours before your audience’s peak activity. For U.S. creators, Saturday evenings (8 PM–11 PM ET) typically yield higher engagement.
- Retention is Key: Videos with a 50%+ completion rate and high rewatch rates are prioritized by YouTube's algorithm. Use hooks, pacing, and pattern interrupts to keep viewers engaged.
Tools like OutlierKit can help you analyze competitor data, identify trends, and implement proven strategies. Viral success isn’t random - it’s about recognizing repeatable patterns and refining your approach with data.
YouTube Viral Video Success Metrics and Performance Benchmarks
Finding Competitors and Setting Performance Baselines
How to Choose Competitor Channels
To get started, identify 5 to 7 channels that cater to your target audience or create content similar to yours. Break them down into three categories: direct competitors (channels in your niche), indirect competitors (channels with different content but overlapping viewers), and aspirational channels (top-performing creators whose style you admire).
YouTube Studio Analytics offers a great starting point. Check the "Other channels your audience watches" panel to see where your viewers spend their time. Another method is to search for your niche's main keywords and note which channels consistently rank in the top five results. Additionally, visit competitor profiles and use the "Channels" tab to see who they follow or feature.
When benchmarking, focus on channels within a 10x subscriber range of your own. For example, if you have 5,000 subscribers, compare yourself to channels with 500 to 50,000 subscribers. This ensures you're analyzing creators with similar resources and opportunities rather than massive channels that might skew your expectations. Lastly, explore the "Your viewers' searches" section in YouTube Studio's Research tab. By identifying the keywords driving traffic, you can uncover which channels dominate those search terms.
Once you've selected your competitor channels, it's time to dive into their metrics to establish performance benchmarks.
Metrics to Track for Comparison
One of the most telling indicators is average views per video. This metric highlights a channel's performance beyond subscriber count. For instance, a channel with 100,000 subscribers averaging 5,000 views per video is likely underperforming compared to a smaller channel with 20,000 subscribers averaging 8,000 views per video. Analyze the last 10–15 uploads from each competitor to identify current trends and patterns.
Beyond views, keep an eye on subscriber growth rates. A healthy target is around a 4% monthly increase. Also, evaluate engagement ratios: a comment-to-view ratio above 1.5% and a like-to-view ratio above 6% suggest strong audience connection and content resonance. Look for standout or "outlier" videos that achieve 3× to 10× the views of a channel's typical uploads. These can reveal topics or formats that capture significant attention. Sorting videos by "Most Popular" can also help you pinpoint evergreen themes that continue to draw viewers over time.
"Average views per video... shows the true, repeatable performance of a channel regardless of subscriber count." – Andy Davidson, Author, TubeBuddy
Finding Content Patterns That Drive Virality
Recurring Themes in High-Performing Videos
Successful viral videos often follow repeatable patterns rather than relying on luck. By studying top-performing competitor content, you can uncover these patterns and apply them to your own videos.
Start by reviewing the titles and thumbnails of your competitors' top 10 videos. Pay special attention to recurring formats. For instance, the "Hidden Problem" theme works wonders by exposing overlooked issues. A fitness creator nailed this with the title, "The Protein Powder Problem Nobody Talks About," racking up 847,000 views by challenging mainstream supplement advice. Similarly, the "Myth Buster" approach flips conventional wisdom on its head. A standout example? A personal finance video titled "Why Budgeting Is Actually Making You Poorer" hit 1.8 million views by questioning a widely accepted practice.
Other winning formats include:
- "Beginner's Secret": Promises expert-level results without the usual beginner struggles.
- "Behind the Scenes": Offers an unvarnished look at success stories.
- "Immediate Gratification": Delivers quick wins, like "7 Apps That Will Save You 2 Hours Today".
Another key strategy is to find underserved niches. For example, while "morning routines" were oversaturated with 47,000+ videos, "evening shutdown routines" had only 340. Creator Jennifer capitalized on this gap, earning 234,000 views in 30 days for her first video on the topic. Her series averaged 87,000 views per video and brought in 12,000 new subscribers in just six weeks.
Visual elements also play a big role. Research shows that:
- 91.3% of top YouTubers feature faces in thumbnails.
- 52.3% use black or dark gray backgrounds for high contrast.
- 58.4% of thumbnails include text, typically 1–3 neutral words like "exposed" or "revealed".
For titles, the ideal length is 6–8 words, averaging 7 words or about 42 characters.
Video Length and Format Analysis
Content themes are just one piece of the puzzle - video length and structure also significantly influence virality. Videos between 6–9 minutes, when paired with a structured approach, achieve an impressive 89% retention rate, compared to only 34% for videos over 12 minutes with traditional formats.
To keep viewers engaged, try the PSPA framework:
- Problem (0–1 min): Introduce the issue.
- Solution (1–4 min): Offer a clear fix.
- Social Proof (4–6 min): Share relatable examples or success stories.
- Action Steps (6–7 min): Give viewers practical next steps.
This structure ensures value is delivered at regular intervals. Productivity creator Sarah used this framework in 2025, boosting her first-minute retention by 67%. Her channel skyrocketed from 847 subscribers to 47,000 in three months, with videos averaging 89,000 views.
Hooks are another critical factor in retention. A three-part hook - featuring a shocking statement (3–5 seconds), a story setup (5–7 seconds), and a value promise (3–5 seconds) - can increase first-minute retention by 73%. For example, tech reviewer David revamped his thumbnails and saw his click-through rate jump from 2.3% to 6.8%. By using strategies like "Contrast Violation" and "Curiosity Gaps", one thumbnail with a shocked expression and a hidden product achieved an 11.2% CTR.
Analyzing Engagement and Upload Timing
Upload Schedules and Posting Frequency
Timing can make or break your video's performance. The most successful creators upload their content 2–3 hours before their audience's peak viewing time. Why? This gives YouTube's algorithm enough time to index the video, gather early feedback from notification-bell subscribers, and build momentum just before the traffic surge begins.
Studies reveal that timing matters - a lot. Posting during the best time slots can outperform the worst by a striking 21%. For creators in the U.S., Saturday evening (8 PM–11 PM ET) is the sweet spot, while Tuesday at 9 AM ET is the least effective. Across the board, weekend uploads tend to perform better, with Saturday showing 6% higher engagement compared to Tuesday.
Interestingly, off-peak hours can also work in your favor. Uploading when fewer creators are active means less competition for the algorithm's attention, giving your content more room to shine.
Keep in mind, different niches have their own rhythms. For example, gaming content tends to perform 3% better on Mondays and Tuesdays, while family-oriented videos see a 5% boost in views and likes between Friday and Sunday. To pinpoint your ideal upload time, use YouTube Studio's "When your viewers are on YouTube" report. Look for the darkest purple bars on the heatmap - those represent your audience's peak activity. Then apply this simple formula:
Optimal Upload Time = Peak Viewer Activity Time - 2 Hours.
Once your timing is dialed in, the next step is understanding how your audience engages with your content.
Measuring Audience Engagement
After nailing your upload schedule, the focus shifts to how viewers interact with your videos. In 2026, completion rate outweighs likes and comments by a factor of five. The algorithm prioritizes whether viewers actually watch your video all the way through, rather than just tapping the thumbs-up button.
"In 2026, the magic number is 50%. If you can keep 50% of your audience until the very last second of the video, you have a viral hit on your hands." – Joyspace AI
One key metric to watch is rewatches, which provide an 84% stronger boost to the algorithm compared to likes or comments. The first hour after posting is especially critical - achieving a 15% engagement rate during this time can trigger exponential growth in reach. When viewers replay your video or let it loop, it signals to YouTube that your content is worth promoting.
Videos with a 92% completion rate earn the coveted "sticky content" label, which can triple their reach. To improve retention, keep a close eye on your retention curve. If the first three seconds drop below 70%, it’s a sign your opening visuals aren’t delivering on the promise of your title. Look for sudden dips or "stairs" in the curve - these are moments where viewers lose interest. Adding pattern interrupts every 5–8 seconds can help re-engage your audience.
The bottom line? High engagement drives greater algorithmic reach. Videos that maintain 70% audience retention often see 35% higher overall engagement rates.
Using Outlier for Data-Driven Insights
How Outlier Analyzes Competitor Data
Outlier takes a deep dive into YouTube's vast content pool, analyzing millions of videos to pinpoint outliers - those that perform 3x to 10x better than a channel's usual baseline. To date, it has processed over 10 million videos across more than 100,000 channels.
The process is straightforward but powerful. Outlier starts by scanning competitor channels, then evaluates the factors driving their standout performance - like hooks, pacing, and even sentence-level retention. Finally, it delivers a formula you can replicate, complete with scripts, keywords, and proven topics. Essentially, it reverse-engineers what works. This method aligns with the viral strategies already discussed, ensuring creators can tap into proven patterns.
Outlier doesn't just stop at surface-level metrics. It uncovers deeper insights, such as emotional triggers, ideal video lengths, and tones that keep audiences hooked. It also identifies niche gaps, or areas where demand is high but competition is minimal. This "blue ocean" strategy is a breath of fresh air for creators looking to escape the shadow of massive channels. With its detailed approach, Outlier provides a foundation for creators to develop impactful content strategies.
What Insights Outlier Provides
Outlier takes raw data and turns it into actionable insights in just 2 minutes. These insights include suggested titles, hooks, confidence scores, and metrics like view velocity. The confidence score, known as the Outlier Score, gauges how much a video's performance exceeds the norm. A 3x–5x score signals strong results, while a 10x+ score highlights exceptional viral potential.
Beyond performance metrics, Outlier also focuses on monetization. Its monetization intelligence identifies high-RPM keywords, helping creators target topics that generate more ad revenue per view. This means you're not just chasing views but also maximizing earnings. It also tracks view velocity, with rapid growth in the first 24–48 hours often indicating a video's viral potential.
"OutlierKit is the first tool that actually improved our view counts almost instantly. The competition analysis revealed gaps we never knew existed." – Gautham, YouTube Strategist
The results speak for themselves. For instance, a DevOps channel with just 8,000 subscribers used Outlier to identify a low-competition keyword, achieving 23,000 views (a 19x outlier) and growing to 24,000 subscribers in six months. Similarly, a small business channel saw average views jump from 400 to 2,400 after applying Outlier's hook insights across 10 videos.
sbb-itb-08cadfc
Implementing Patterns to Increase Virality
Testing and Adjusting Your Strategy
Once you've identified patterns from competitors, it's time to put them to the test. Start small by testing one pattern per week and analyzing its performance after seven days. This step-by-step approach makes it easier to pinpoint which changes are driving results.
For a more intense approach, try the 10-Video Validation Sprint. This involves creating 10 versions of a single pattern within a 7–14 day period while keeping key variables - such as your voice, video length, and posting schedule - consistent. Only tweak one element at a time, like the hook, opening visual, or call-to-action. This method offers clearer insights than testing a single video, which might succeed or fail due to random factors.
Take inspiration from others who’ve refined their strategies. In 2025, Marcus increased his first-minute viewer retention from 34% to 58% in just two weeks by reworking his intros with a three-part hook formula: Shocking statement, Story setup, and Promise. Similarly, Jennifer found an untapped opportunity in the productivity niche. While "morning routines" had over 47,000 videos, there were only 340 on "evening shutdown routines." Her series on evening routines averaged 87,000 views per video and brought in more than $50,000 in course sales.
To make these strategies repeatable, build a Pattern Library. Use "Pattern Cards" to document each pattern's name, its promise to viewers, specific hook lines, and structural elements (e.g., "0–1s: show result; 1–3s: contrarian claim"). This system transforms your insights into templates you can reuse and adapt. As you test, compare your results against your starting metrics to measure growth effectively.
Comparing Results to Track Growth
After testing different patterns, it’s crucial to measure your progress. Start by documenting your baseline metrics - views, click-through rates (CTR), and retention rates - to create a control group for comparison.
To evaluate performance, calculate your Outlier Score. This metric normalizes view counts by dividing a video's views by your account's median views over the same time period. A score of 3x–5x suggests strong performance, while 10x+ signals a format with serious viral potential. This method helps uncover standout content regardless of your overall audience size.
Engagement ratios also provide valuable insight. A comment-to-view ratio above 1.5% reflects strong community interaction, while a like-to-view ratio over 6% indicates content that resonates deeply. Videos with retention rates exceeding 70% often see 35% higher engagement rates. These benchmarks reveal not just how many people watched but how much they connected with your content.
Dive deeper by analyzing retention curves frame-by-frame. A sharp drop at the 5-second mark might point to a weak opening, while dips in the middle could highlight pacing issues. Responding to comments and engagement within the first 4 hours can boost a video's reach by up to 156%. Allow yourself a 2–3 month window to test, analyze, and refine your strategy. This timeframe provides enough data to make informed decisions without rushing into changes that might not stick.
I Analyzed 93,421 Viral Videos. Here's What I Learned...
Conclusion
Creating viral content isn’t about luck - it’s about recognizing and using clear, repeatable patterns. By studying competitor data, you can uncover what drives views, engagement, and growth. Pay close attention to outlier videos - those that perform 3–10x better than average - as they reveal what truly connects with audiences. This approach ties directly to every strategy discussed earlier.
Start by identifying competitors in your niche, then analyze their top-performing videos to spot trends you can adapt. Whether it’s experimenting with new hook styles, tweaking video lengths, or addressing gaps your competitors have overlooked, making decisions based on data beats random posting every time.
"The 5% that succeed aren't lucky. They follow predictable patterns." – Aditi, Founder of OutlierKit
Outlier simplifies this process by offering quick, actionable insights. In just two minutes, it provides personalized video ideas based on competitor data, saving you hours of manual research. These insights include suggested titles, hooks, and confidence scores, helping you craft content with a higher chance of success.
Keep in mind, most videos don’t perform well. The difference lies in leveraging data to guide your strategy. By consistently analyzing results, refining your methods, and focusing on proven patterns, you can shift from unpredictable outcomes to steady, repeatable growth.
FAQs
How can I use competitor data to uncover viral video trends?
To spot viral video trends in your niche, start by diving into the content strategies of top creators in your field. Pay attention to recurring patterns in video formats, attention-grabbing hooks, pacing, and topics that consistently pull in high engagement and views. Studying competitor data can give you a clear picture of what resonates with audiences, offering ideas you can incorporate into your own content.
Keep an eye on outlier videos - those rare gems that perform far better than a creator's usual uploads. These videos often reveal fresh trends or innovative approaches that spark virality. Pair these observations with insights from data-driven tools to uncover patterns that work. Then, tweak and tailor these strategies to craft content that grabs attention and clicks with your audience.
What metrics should I track when analyzing competitor YouTube channels?
To get a clearer picture of your competitors' strategies, dive into key performance metrics such as engagement rates - this includes views, likes, shares, and comments - alongside watch time and audience retention. These numbers give you a strong sense of what content their audience connects with the most.
You should also pay attention to their click-through rates (CTR), how often they upload, and how effective their titles, thumbnails, and hooks are. These elements often reveal patterns and trends that contribute to their success. Keep an eye on their subscriber growth and identify any content gaps - they might just point to opportunities for your own channel.
Tools like Outlier can make this process much easier by offering data-driven insights. They can help you pinpoint high-performing topics, video formats, and standout strategies. Pairing this analysis with your own creativity can give you a serious edge.
How does the timing of your video uploads impact its chances of going viral?
Timing your video uploads can play a big role in whether your content goes viral. For example, posting during high-traffic times like Saturday evenings in the US often leads to greater engagement. Why? More people are online and ready to watch. In fact, videos uploaded during these peak hours can perform up to 21% better than those posted at other times.
The first 24 hours after uploading are absolutely crucial. If your audience is active when your video goes live, you're more likely to rack up early likes, comments, and shares. These interactions are key because they signal YouTube's algorithm to push your video to a broader audience. By using data to schedule uploads when your viewers are most engaged, you can give your content a better shot at going viral.


