
How to Customize YouTube Analytics Dashboards
Want to grow your YouTube channel? Start by customizing your analytics dashboard.
YouTube's default analytics can overwhelm you with numbers. But not all data is useful. By focusing on key metrics like watch time, click-through rate (CTR), and audience retention, you can make smarter decisions to improve your content and grow your channel.
Here’s what you’ll learn:
- How to access and navigate YouTube Analytics.
- The purpose of each analytics tab (Overview, Reach, Engagement, Audience, Revenue).
- Using Advanced Mode to create custom reports and compare data.
- Filtering, saving, and sharing reports for better insights.
- Tools like Outlier to find winning video ideas.
Example - Customizable YouTube Analytics Dashboard You NEED
sbb-itb-08cadfc
How to Access YouTube Analytics
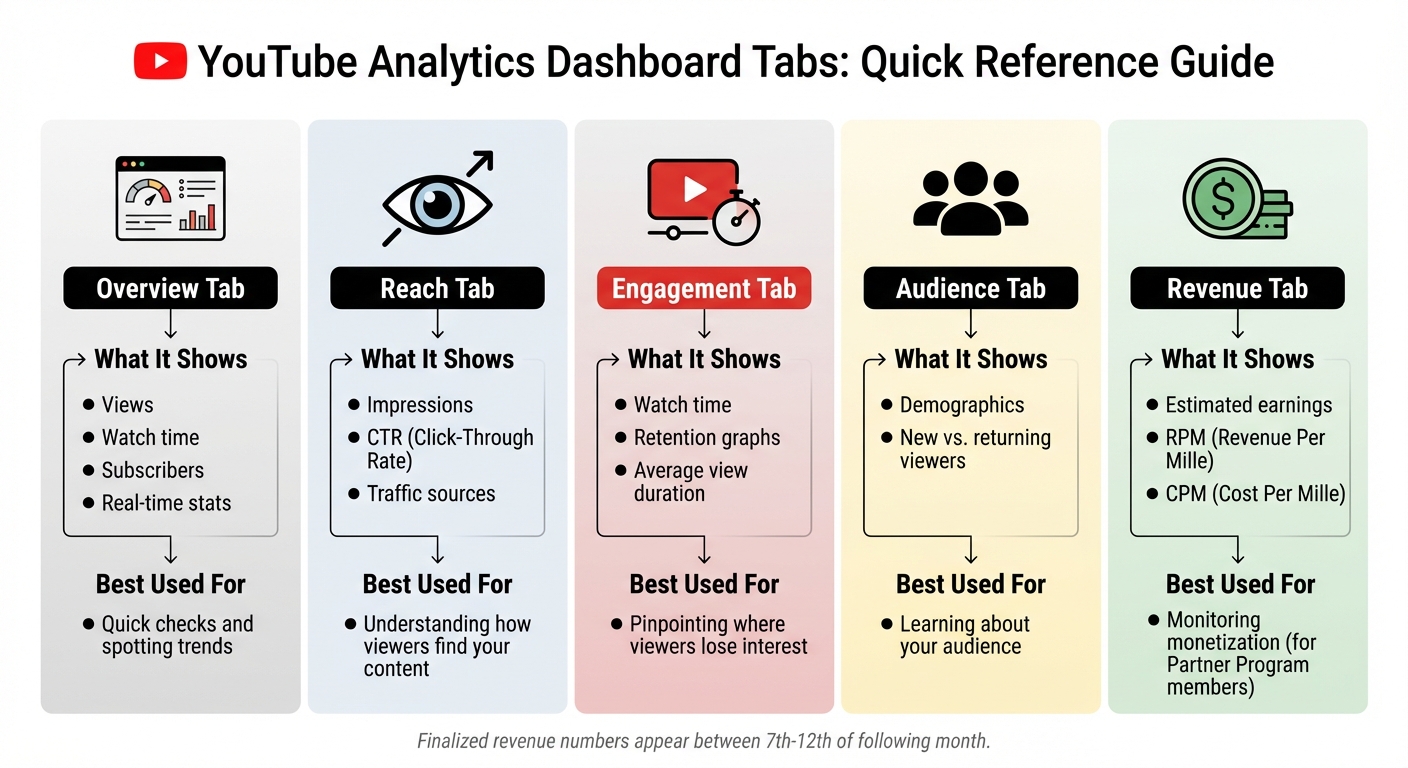
YouTube Analytics Dashboard Tabs Quick Reference Guide
Opening YouTube Studio Analytics
Getting into YouTube Analytics is straightforward. Start by signing in at studio.youtube.com. Once you're in, click on Analytics in the left-hand menu to see an overview of your channel's performance.
If you manage multiple channels, double-check that you're logged into the right account to avoid pulling up the wrong data.
For insights on a specific video, head to the Content tab. Hover over the thumbnail of the video you’re interested in and click the Analytics icon that pops up. On the main dashboard, you'll also find a Channel Analytics card, which gives you a quick snapshot of views, subscribers, and watch time from the past 28 days. To get the most out of your data, take some time to understand what each default tab offers.
Understanding the Default Analytics Tabs
YouTube organizes analytics into several tabs, each focusing on different metrics. Here's a breakdown of what each tab covers:
- The Overview tab gives you a summary of views, watch time, subscriber changes, and real-time stats for your most recent uploads. This is a great place to start if you're looking for trends.
- The Reach tab highlights how many people saw your thumbnail and how many clicked on it, showing metrics like impressions and click-through rate (CTR).
- The Engagement tab focuses on viewer behavior, including how long they watch your videos and where they tend to stop watching.
- The Audience tab dives into demographics like age, gender, location, and whether viewers are new or returning.
For quick reference, here's a handy table summarizing the purpose of each tab:
Tab
What It Shows
Best Used For
Overview
Views, watch time, subscribers, real-time stats
Quick checks and spotting trends
Reach
Impressions, CTR, traffic sources
Understanding how viewers find your content
Engagement
Watch time, retention graphs, average view duration
Pinpointing where viewers lose interest
Audience
Demographics, new vs. returning viewers
Learning about your audience
Revenue
Estimated earnings, RPM, CPM
Monitoring monetization (for Partner Program members)
If you're part of the YouTube Partner Program, the Revenue tab provides estimated earnings. Keep in mind that finalized numbers usually appear between the 7th and 12th of the following month.
Lastly, the Trends tab is a research tool that shows what people are searching for across YouTube. This can help you find gaps in content that your channel could address. Once you’re familiar with these default tabs, you can explore Advanced Mode for even more detailed insights.
How to Enable Advanced Mode
Turning On Advanced Mode
To activate Advanced Mode in YouTube Studio, log in at studio.youtube.com, head to the Analytics section, and click the ADVANCED MODE button. Alternatively, you can select SEE MORE under any report to access it directly. Keep in mind, only owners or managers of the account can access all features - viewer-level accounts will have limited access to data.
For the best experience, use a desktop browser instead of the mobile app. Some features, like expanded reports and customization tools, aren't fully available on mobile devices.
Once enabled, Advanced Mode offers tools to transform raw data into deeper insights.
What Advanced Mode Offers
Advanced Mode provides tools that go beyond the default analytics tabs. You can customize charts and tables by adding or removing specific metrics from categories like Reach, Interactions, Revenue, or even specialized data for Shorts and Live streams.
Some standout features include:
- Detailed breakdowns: View over 20 dimensions such as traffic source, geography, viewer age, gender, and device type.
- Comparison tools: Use the "Add comparison" option or apply filters based on subscription status, operating system, or product type (e.g., YouTube Kids, Gaming) to evaluate performance across videos, groups, or time periods.
- Drill-down functionality: Clicking blue text in tables allows you to dive deeper. For instance, selecting "YouTube search" reveals the exact keywords viewers used to find your content.
You can also organize and analyze content in groups. Create groups of up to 500 videos, playlists, or channels to assess their combined performance as a single unit. Save up to 50 custom reports for quick access later.
"Advanced mode provides the tools to understand your audience and optimize your channel." - Google Help
Be aware that grayed-out metrics indicate either insufficient data or incompatibility with your current view. For newer channels or videos with low traffic, you might see "not enough data" until more activity is recorded.
These tools allow for tailored customizations of your analytics dashboard, which will be explored in the next section.
How to Customize Your Dashboard
Choosing Your Metrics
Once Advanced Mode is enabled, head to the Metrics picker to add or remove KPIs based on your channel's goals. Your choice of metrics should reflect what matters most for your objectives. For instance, if retention is your priority, focus on Watch Time and Average View Duration. On the other hand, if monetization is your aim, include metrics like Revenue, RPM (Revenue per Mille), and CPM.
You can organize your metrics into three main categories:
- Reach: Metrics like impressions, click-through rate (CTR), and unique viewers help you understand how people are discovering your content.
- Engagement: Metrics such as watch time and average view duration reveal how effectively your videos hold viewers' attention.
- Audience: Indicators like returning viewers and subscriber growth provide insights into viewer loyalty and channel growth.
Customizing your dashboard this way helps you focus on actionable insights that can drive your channel's success. YouTube Analytics identifies 15 key metrics as essential for data-driven growth in 2026, including tools like the Audience Retention Curve and Subscriber Growth Rate.
"The difference between channels that grow and those that plateau lies in how precisely teams track and interpret the signals that actually drive discovery and audience retention." - Improvado
To get the most out of your data, segment it by content type - whether Shorts, Live streams, or long-form videos. Each format performs differently, and aggregated data can sometimes paint a misleading picture. For example, a low CTR paired with a strong average view duration may indicate that your content is engaging but needs better thumbnails or titles. Use the Audience Retention Curve to identify when viewers tend to drop off; if there’s a sharp decline in the first 30 seconds, it could mean your intro needs improvement.
Once you've chosen your metrics, you can refine your analysis further with filters and comparisons.
Adding Filters and Comparisons
To drill down into your data, use the Filter option to focus on specific dimensions like geography, subscription status, content type, or device type. For example, filtering by subscription status can help you see how your content resonates with loyal subscribers compared to new viewers. Filtering by video titles, such as those containing "Tutorial", can provide insights into how a particular series is performing.
The Add comparison feature allows you to analyze data side-by-side. You can compare videos, groups, or time periods - for instance, overlaying "Last 90 days" with "Previous 90 days" to spot trends in growth. You can also create custom Groups of up to 500 videos, playlists, or channels to view their combined performance. After setting up your dashboard, save it as a Saved Report for quick access. YouTube Studio lets you save up to 50 unique custom reports.
How to Save and Share Your Dashboards
Saving Your Custom Dashboard
Once you've set up your metrics, filters, and comparisons, click Save in the top navigation bar to keep your custom view intact. YouTube Studio will ask you to name your report - choose something descriptive like "Monthly Shorts Performance - India" or "Q1_Engagement_Comparison" so you can easily recognize it later. Your saved reports will then appear under the Saved reports tab in Advanced Mode, providing quick access whenever you need them.
Each user can save up to 50 custom report configurations. If you hit this limit, you can free up space by unsaving older reports. Just find the report, click the filled save icon, and it will be removed from your saved list. Keep in mind, saved reports are private and won’t sync across different accounts.
Once your dashboard is saved, exporting it allows for easy collaboration.
Exporting and Sharing Reports
To share your customized dashboard with others, click the Export current view icon (a downward arrow) in the top-right corner of Advanced Mode. YouTube lets you export your view directly to Google Sheets (which opens in a new tab) or as a Comma-separated values (.csv) file. Note that manual exports are limited to 500 rows of data. For larger datasets, you’ll need to rely on the YouTube Reporting API.
Since saved reports are private and don’t sync across accounts, exporting is the simplest way to share specific insights. If you export to Google Sheets, you can easily share the file using Google’s built-in sharing options, allowing collaborators to view the data without needing direct access to your YouTube channel.
"Native access requires sharing login credentials or manual CSV exports, which slows team collaboration." – Sprout Social
For ongoing reporting needs, consider using third-party tools to automate data syncing.
Using Outlier for Video Ideas
How Outlier Works
Custom dashboards are great for analyzing past performance, but Outlier takes it a step further by helping you uncover fresh, data-driven video ideas. Unlike YouTube Analytics, which focuses on what has already happened, Outlier predicts your next big hit by analyzing competitor data.
Here’s how it works: the platform reviews the last 90 days of content from competitor channels to pinpoint "outlier" videos - those that outperform a channel’s historical averages by a significant margin. In just 2 minutes, Outlier identifies recent videos (published within the last two weeks) that have achieved at least twice the typical view count. It then delivers personalized video ideas complete with suggested titles, hooks, and confidence scores.
To date, Outlier’s detection system has analyzed over 10 million videos and flagged more than 1 million outlier videos. It digs into factors like hooks, pacing, keywords, and retention rates to uncover the elements driving success.
The platform doesn’t stop there. It provides insights on metrics like view velocity - how quickly a video gained views in its first 24-48 hours - and identifies "topic gaps", which are subjects your competitors are overlooking or niches with untapped growth potential. This gap analysis is especially useful for finding low-competition keywords where smaller channels can gain visibility.
Why YouTube Creators Use Outlier
The main draw? Outlier eliminates the guesswork from content planning. Instead of relying on intuition to brainstorm ideas, you’re armed with solid data about what’s already working in your niche. Considering that 95% of YouTube videos get fewer than 1,000 views, this approach gives you a much better shot at creating content that resonates.
"Developing your idea off of an Outlier gives you a better chance of the video connecting with your audience. Especially if you choose an Outlier your audience also watches." – Spotter Studio
Another big advantage is the time it saves. Manually researching competitors often takes hours of spreadsheet analysis to calculate averages and spot trends. Outlier automates the entire process, delivering actionable insights in minutes. Plus, without requiring a subscription or account connection, it instantly provides 10 ready-to-use video ideas, complete with all the data you need to make informed decisions.
Conclusion
Customizing your YouTube Analytics dashboard transforms overwhelming data into clear insights that can fuel your channel's growth. By zeroing in on the metrics that matter most - like audience retention, traffic sources, or subscriber growth - you can focus on what’s driving results. As Klipfolio puts it, "A YouTube analytics dashboard is a window into what's working or what's not". This visibility gives you an edge in navigating YouTube’s ever-changing landscape.
The real advantage lies in combining your internal analytics with external tools. While your dashboard monitors key performance indicators like average view duration and click-through rates, tools like Outlier complement this by providing data-driven content ideas. This synergy reduces guesswork and adds depth to your strategy, helping you make more informed decisions.
Consistent dashboard reviews are essential for staying aligned with your goals and adapting to YouTube’s evolving algorithm. By 2026, 89% of successful creators have credited data-driven strategies for their growth. Regularly analyzing trends in retention, engagement, and traffic sources can help you identify patterns and distinguish fleeting viral moments from sustainable success.
FAQs
Which 3 YouTube metrics should I track first?
When you're working to grow your YouTube channel, certain metrics are key to understanding your audience and improving your content. Here are the top three you should start with:
- Watch Time: This measures how long viewers stick around to watch your videos. It’s a great indicator of how engaging your content is and plays a big role in your channel's overall growth.
- Click-Through Rate (CTR): CTR tells you how well your video titles and thumbnails are doing their job. A higher CTR means more people are clicking to watch after seeing your video in search results or recommendations.
- Audience Retention: This metric shows you where viewers tend to drop off in your videos. By analyzing these points, you can pinpoint which parts of your content keep people hooked - and which parts might need a little tweaking.
These three metrics give you a solid starting point for improving your channel’s performance and creating content that resonates with your audience.
Why does my video have low CTR but high watch time?
A low click-through rate (CTR) paired with high watch time suggests that while your content is engaging, your thumbnail or title might not be grabbing enough attention to get people to click. To tackle this, focus on creating more eye-catching thumbnails and crafting titles that spark curiosity or interest. At the same time, keep delivering content that holds viewers' attention once they start watching.
When should I use Advanced Mode instead of the default tabs?
Advanced Mode in YouTube Analytics is your go-to tool when you need more detailed, flexible insights than the default reports offer. It allows you to dive into granular metrics, making it easier to analyze specific aspects of your channel's performance.
With Advanced Mode, you can:
- Filter data by geography, traffic sources, or other key dimensions.
- Create custom video groups to compare performance across different types of content.
- Export data for use in external tools, enabling deeper analysis or integration into dashboards.
This feature is particularly useful for comparing performance trends across segments or using the data to build customized reports for your specific needs.


