
Ultimate Guide to Competitor Engagement Metrics
Want to grow on YouTube? Understanding competitor engagement metrics is your shortcut to success. Metrics like likes, comments, shares, average watch time, and view counts reveal what’s working in your niche - and how you can improve.
Why It Matters:
- Track What Works: See which videos outperform and why.
- Set Realistic Goals: Use competitors’ data to establish benchmarks.
- Spot Gaps: Identify missed opportunities in your niche.
Key Metrics to Watch:
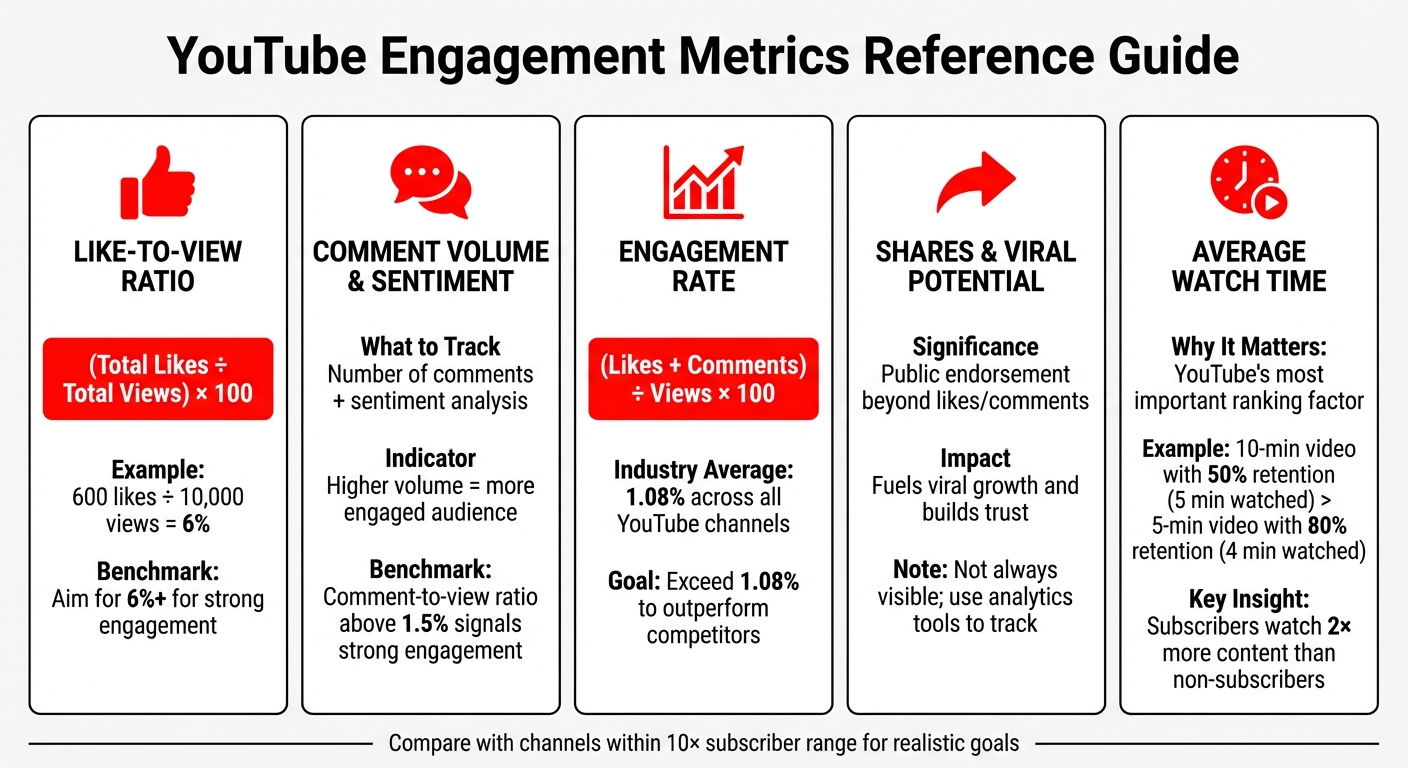
- Like-to-View Ratio: Shows audience appreciation (aim for 6%+).
- Comment Volume & Sentiment: Indicates interaction and feedback.
- Engagement Rate: Combines likes and comments for overall interaction.
- Shares: Signals content value and viral potential.
- Average Watch Time: Critical for YouTube’s ranking algorithm.
Tools to Simplify Analysis:
- Use platforms like Outlier, VidIQ, or TubeBuddy to analyze competitor performance quickly.
- Organize data in spreadsheets to track trends over time.
Pro Tip: Focus on ratios (like-to-view, comment-to-view) over raw numbers to find truly engaging content. This data-driven approach helps you refine titles, thumbnails, and posting schedules for better results.
Conclusion: By studying competitors’ engagement metrics, you can create content that resonates, outperform others in your niche, and grow your channel effectively.
How To Benchmark Competitor Engagement Rates?
Key Engagement Metrics to Track
YouTube Engagement Metrics Benchmarks and Formulas
Understanding the right metrics can reveal what makes competitor content resonate with audiences - and how you can apply those lessons to your own strategy.
Like-to-View Ratio
The like-to-view ratio is a quick way to gauge how much viewers appreciate a video. It compares the number of likes a video gets to its total views. A higher ratio means viewers didn’t just watch - they actively supported the content.
To calculate this ratio, divide the total likes by total views, then multiply by 100. For example, if a video has 600 likes and 10,000 views, the like-to-view ratio is 6%. When studying competitors, focus on videos with unusually high ratios. These often reflect standout content that’s worth analyzing and adapting for your channel.
But don’t stop at likes - comments can provide even deeper insights into audience engagement.
Comment Volume and Sentiment
The number of comments a video generates shows how much viewers are interacting with the content. For instance, if two videos have similar view counts but one has significantly more comments, it’s a sign of a more engaged audience. However, sheer volume isn’t enough. Digging into the sentiment behind those comments can uncover recurring themes, like audience frustrations or interests.
Competitor comment sections are a goldmine for spotting questions, feedback, or overlooked topics - clues that could guide your own content strategy.
Engagement Rate Formula
The engagement rate combines likes and comments into one metric to measure overall audience interaction. Use this formula:
(Likes + Comments) ÷ Views × 100
This metric shows how well a channel converts passive viewers into active participants. For context, YouTube’s average engagement rate across industries is around 1.08%. Compare your rate with channels of a similar size (within a 10× subscriber range) to set realistic goals. Higher engagement rates often point to strong storytelling, a clear connection with the audience, and a loyal fan base.
Now, let’s look at how shares can boost a video’s reach.
Shares and Viral Potential
Shares are a powerful indicator of content value. When someone shares a video, they’re making a public endorsement - a step beyond liking or commenting. This action fuels viral growth and builds trust in your brand.
Even though YouTube doesn’t always display share counts, tools like analytics platforms or social media trackers can help you monitor this metric. By identifying competitor videos with high share rates, you can analyze their hooks, formats, or timing to craft content with similar viral appeal.
Average Watch Time
Watch time, which measures the total minutes viewers spend on a video, is one of YouTube’s most important ranking factors. The platform prioritizes videos that keep viewers engaged longer since this translates to higher ad revenue. For example, a 10-minute video with a 50% average view duration (5 minutes watched) often outperforms a 5-minute video with 80% retention (4 minutes watched), simply because the total watch time is higher.
When analyzing competitors, don’t just look at view counts - focus on retention patterns. A channel with fewer subscribers but higher average watch time per video might have a more engaged audience. It’s also worth noting that subscribers typically watch twice as much content as non-subscribers. This makes watch time a reliable indicator of audience loyalty and complements other metrics in identifying content that truly connects with viewers.
How to Collect and Analyze Competitor Data
Once you’re familiar with key engagement metrics, the next step is gathering and analyzing competitor data systematically. Start by using YouTube’s free tools for data collection, then consider specialized tools to dig deeper. Here’s how to approach both methods effectively.
Manual Data Collection Using YouTube
Begin by identifying 5–7 competitor channels, including direct rivals, indirect players, and aspirational creators. Visit their "Videos" tab, sort by "Most Popular", and look for videos that achieve 5–10 times the channel's average views. These are likely indicators of topics that resonate strongly with audiences. Pay attention to video descriptions - note recurring keywords and the structure of their calls to action. Examining thumbnail styles across top-performing videos can also offer insights into what grabs attention in your niche.
Don’t overlook the Community tab. This section often reveals recurring questions and engagement patterns. As marketing expert Nia Patel points out:
Your competitors' comment sections can also be a good place to go to because they might find their audience members suggesting ideas that the competitor hasn't posted yet.
Reading the top 20–30 comments on high-performing videos can help you gauge audience sentiment - whether it’s positive, negative, or inquisitive. This feedback can highlight content gaps your competitors haven’t addressed yet.
Additionally, YouTube Studio’s "Research" tab is a powerful tool for finding audience overlap and identifying content gaps. It shows where your viewers are engaging with other creators, offering clues to refine your strategy. Just keep in mind that YouTube Analytics data typically has a short delay before it’s fully updated.
Using Tools for Faster Analysis
Manual methods work well, but specialized tools can save significant time and uncover trends you might miss. For instance, Outlier analyzes competitor channels by reviewing their last 90 days of content. In just two minutes, it provides personalized video ideas, complete with suggested titles, hooks, and confidence scores. Simply input a competitor’s URL, and the platform highlights videos that outperform by 3–10 times, along with insights into effective hooks and pacing.
Browser extensions like VidIQ and TubeBuddy add real-time SEO data, tags, and view velocity directly to YouTube’s interface. For a deeper dive into audience sentiment, AI-powered tools can scan thousands of comments in minutes, identifying recurring themes and pain points.
These tools are particularly useful when tracking multiple competitors. Tasks that might take an hour manually can often be completed in just a few minutes, freeing up time for other strategic efforts.
Organizing Data with Spreadsheets
To make sense of the data you collect, use a spreadsheet to track key engagement ratios. Focus on ratios rather than raw numbers. For example, a video with 50,000 views and 3,000 comments may provide more actionable insights than one with 500,000 views but only 2,000 comments.
Create columns for details like video title, upload date, views, likes, comments, and engagement rate. Adding a "Content Pillar" column - categorizing videos into types like tutorials, reviews, or challenges - can help you identify which formats drive the most engagement. Monitor these metrics over a 90-day period to spot trends such as seasonal shifts, changes in upload frequency, or variations in video length.
Lastly, arrange the last 20 thumbnails side-by-side in your spreadsheet (without titles) to identify recurring design elements linked to view spikes. This visual comparison can reveal patterns that might otherwise go unnoticed, helping you refine your approach to thumbnails and overall content strategy.
sbb-itb-08cadfc
Benchmarking Against Competitors
Building on earlier data collection methods, benchmarking helps you identify where your content stands within your industry and highlights both standards and outliers.
Calculating Averages and Finding Top Performers
When analyzing competitors, focus on ratios rather than raw numbers. For example, a channel with 20,000 subscribers and a 4% like-to-view ratio demonstrates higher audience engagement compared to a competitor with 200,000 subscribers and only a 1.5% ratio.
Start by calculating the average views from the last 10–20 uploads. Pay special attention to outlier videos - those with 3–10 times the average views. For instance, if a competitor averages 15,000 views but one video hits 120,000, examine its hook, pacing, and topic to uncover why it resonated so strongly.
Since private metrics like view duration aren’t accessible, rely on public indicators such as rapid shares, frequent comments, or active engagement during premieres to estimate retention rates. On YouTube, the average engagement rate is around 1.08%. Competitors consistently exceeding this threshold are likely using effective tactics worth studying.
Creating Comparison Tables
A practical way to benchmark is by creating a spreadsheet to track 5–10 competitors over 30–60 days. Include metrics like:
- Average views per video
- Like-to-view ratio
- Comment-to-view ratio
- Upload frequency
- Subscriber growth
Focus on competitors that are similar in size or target the same niche. Add a column for content categories (e.g., tutorials, reviews, vlogs) and calculate the average views for each type. This helps identify which formats are driving the most traction in your niche.
For deeper insights, compare engagement metrics. For instance, a video with 50,000 views and 3,000 comments offers more actionable data than one with 500,000 views but only 2,000 comments. The higher comment-to-view ratio signals stronger audience interaction.
Combine quantitative data (views, likes, comments) with qualitative observations, such as thumbnail design, hooks, or call-to-actions. This dual approach can reveal patterns that numbers alone might miss.
Once your comparison table is complete, shift your focus to uncovering content gaps and opportunities.
Finding Gaps and Opportunities
Look for friction points in competitor content - situations where videos achieve high reach but have low retention or where comment sections are filled with unanswered questions. These gaps are your chance to address unmet audience needs. For example, a comment-to-view ratio above 1.5% signals strong engagement, while a like-to-view ratio over 6% indicates content that resonates deeply with viewers.
Also, analyze competitors’ posting schedules. If most post on Tuesdays and Thursdays, consider publishing on Mondays or Wednesdays to stand out. Look for other constraints, such as overly rigid production formats, language barriers, or unappealing tones. As ScaleLab aptly puts it:
Your competitor's constraint is your playground.
Finally, dig into the keywords and tags used in top-performing videos. Tools like Outlier can analyze competitors’ last 90 days of content to identify videos that outperform by 3–10 times, offering insights into hooks, pacing, and adjacent keywords competitors may have missed. This method turns competitor analysis into a repeatable strategy for discovering what works - and what opportunities are waiting in your niche.
Turning Data into Content Strategies
Once you've established clear benchmarks, it's time to transform your insights into actionable strategies. This is where raw data evolves into a system you can rely on for consistent growth.
Refining High-Performing Content Formats
Take cues from your top-performing videos to fine-tune key format elements. Look closely at how successful videos handle hook delivery (how quickly they deliver on the promise of the title), transitions (how often new segments are introduced), and narrative payoff (whether they close the curiosity loop they started). With 95% of YouTube videos getting fewer than 1,000 views, understanding what sets the top 5% apart is essential.
Identify the "keyword spine" - the core phrases your competitors use - and see how they incorporate these into titles, descriptions, and tags. Break down competitor videos into categories like interviews, how-tos, case studies, or memes to figure out which types drive the most engagement. Since retention graphs are private, rely on public indicators like like-to-view ratios (above 6% suggests strong appeal) and comment frequency (over 1.5% indicates high engagement) to gauge viewer interest.
Tools like Outlier can help you spot videos that outperform by 3–10×, offering insights into hooks, pacing, or even overlooked keywords.
Optimizing Posting Schedules and Hooks
Study how often your competitors post - most successful channels publish 1–3 times a week - and pinpoint the days and times when their audiences are most active. If their uploads cluster around Tuesdays and Thursdays, consider posting on Mondays or Wednesdays to avoid direct competition.
Focus on the first 30 seconds of top-performing videos to uncover what makes their hooks effective. Proven hook strategies include:
- Problem + Promise: Highlighting a pain point and offering a solution.
- Curiosity Loops: Creating a gap in knowledge that viewers want to close.
- Immediate Value: Previewing specific takeaways upfront.
Keep viewers engaged with pattern interrupts - like B-roll footage, on-screen text, or quick camera zooms - every 15–20 seconds. Videos that retain at least 40% of viewers in the first 30 seconds are far more likely to go viral.
Swapni, Founder of Cactro, shared their experience:
"The script analysis feature is incredible. It showed me exactly why my hooks weren't working. Fixed it, and my numbers improved dramatically."
If your audience retention dips in the first 30 seconds, test new hook variations. Compare your structure with successful formats in your niche, adjusting pacing or curiosity loops as needed. Remember, a click-through rate (CTR) of 6% to 8% can significantly boost impressions within the algorithm.
Monitoring Progress Over Time
With your benchmarks and refined formats in place, focus on tracking targeted metrics to measure growth. Move beyond raw view counts and monitor engagement ratios - like-to-view and comment-to-view rates - to see how your content resonates compared to competitors. Prioritize CTR and audience retention as key indicators of whether changes, like updated hooks or thumbnails, are paying off.
Evaluate new strategies in the first 48–72 hours after posting to make quick adjustments if CTR is underwhelming. Watch "Subscribers Gained" per video to assess the effectiveness of content formats inspired by competitor insights. Aim for a retention rate of 70% to 85%, as this can dramatically increase video views.
AI tools can also track shifts in comment sentiment and recurring feedback after you implement new approaches.
As MrBeast wisely put it:
"I study what works before I create anything new."
– MrBeast
Schedule monthly reviews to compare your current metrics with both your baseline and competitor benchmarks. This feedback loop turns competitor insights into measurable growth, with data-backed strategies delivering up to 10× better results than content created without research.
Conclusion
It seems there was an issue with the original text, making it unreadable and filled with repetitive and unclear content. If you need help rewriting or clarifying the conclusion, please provide the intended message or context, and I can craft a coherent and meaningful conclusion for you.
FAQs
How can I use competitor engagement metrics to grow my YouTube channel?
To grow your YouTube channel, competitor engagement metrics like viewer retention, likes, comments, and shares are invaluable. These numbers give you a clear picture of what content connects with audiences and where you might improve.
Dive deeper into patterns like hooks, pacing, and keywords to see how successful creators keep their viewers engaged. For instance, analyzing the length of a hook or the flow of a narrative can inspire tweaks to your own video format, helping you hold your audience's attention longer.
Armed with these insights, you can fine-tune your titles, thumbnails, and video pacing to boost both click-through rates and viewer retention. Using competitor engagement data as a guide, you’ll have a solid strategy to create content that grabs attention and helps your channel grow.
What are the best tools for analyzing competitor engagement on YouTube?
To get a better handle on competitor engagement on YouTube, having the right tools makes all the difference. Outlier is a powerful option that stands out by offering data-driven video ideas specifically tailored to your channel. It analyzes competitor content and trends to generate insights like suggested titles, hooks, confidence scores, and supporting data - all within minutes. This can help you pinpoint what’s working for top-performing channels.
Other helpful tools include YouTube Studio, which provides in-depth audience engagement metrics directly within the platform, and Brand24, which tracks trends and identifies viral content. Using these tools, creators can gain a deeper understanding of their competitors, fine-tune their strategies, and produce content that truly connects with viewers.
Why is the like-to-view ratio important for YouTube creators?
The like-to-view ratio serves as a crucial measure of how effectively your content resonates with your audience. When this ratio is high, it signals that viewers aren't just watching your video - they're finding it engaging enough to hit the like button.
This metric doesn't just reflect audience approval; it can also impact YouTube's algorithm. Videos with higher engagement are more likely to gain visibility, potentially reaching a larger audience. Keeping an eye on this ratio helps creators fine-tune their content strategy, zeroing in on what truly connects with their viewers.


