
How To Use Analytics For Better Video Ideas
Using YouTube analytics can transform your video strategy by showing you what your audience wants. Instead of guessing or copying trends, analytics highlights what works: from high-retention segments to search terms driving traffic. By analyzing metrics like watch time, audience retention, and traffic sources, you can refine your content to meet viewer demand. Tools like Outlier further enhance this by analyzing competitor trends and identifying untapped opportunities.
Key Takeaways:
- Use watch time and retention graphs to identify engaging parts of your videos.
- Study traffic sources and search terms to find topics viewers are actively seeking.
- Spot drop-off points to improve pacing and structure.
- Tools like Outlier reveal competitor strategies and trending topics with low competition.
How to Access and Navigate YouTube Analytics
Opening Analytics in YouTube Studio
Getting into YouTube Analytics is simple. Start by signing in to YouTube Studio, either on your desktop or through the mobile app. On desktop, you’ll find the "Analytics" option in the left-hand menu. Alternatively, if you want data for a specific video, head to the "Content" section and click the Analytics icon for that video. If you’re managing someone else’s channel, make sure you’ve been given "Viewer" or "Editor" permissions in YouTube Studio settings; without these, you won’t see the Analytics tab. On mobile, tap your profile picture, select "Your Channel", and then hit the graph icon.
Once inside Analytics, you’ll notice several tabs at the top: Overview, Content, Reach, Engagement, Audience, and Trends (sometimes labeled as "Research"). Each tab focuses on a different aspect of your channel’s performance. For instance, the Overview tab gives you a quick snapshot of views, watch time, and real-time stats. The Reach tab shows how viewers discover your videos, including impressions and click-through rates. The Engagement tab dives into how long people stick around, while the Audience tab offers insights into who’s watching and when they’re most active.
Want to dig deeper? Click the "Advanced Mode" button in the top-right corner. This unlocks custom tables, allows you to compare performance over different time periods, and even lets you export data for further analysis.
Now, let’s talk about the metrics that really matter when planning your next video.
Which Metrics Matter Most
When brainstorming video ideas, some numbers are more important than others. Watch time is a big one - it tracks the total minutes viewers spend on your content. YouTube’s algorithm leans heavily on this metric to gauge the quality of your videos. Another key metric is audience retention, which shows where viewers drop off or rewatch parts of your video. This can help you pinpoint exactly what’s resonating and what might need tweaking.
Click-through rate (CTR) is another critical stat. It measures how often viewers click your video after seeing its thumbnail. If you notice a high CTR but a low average view duration, it might mean your title and thumbnail are grabbing attention, but the content isn’t meeting expectations. Lastly, traffic sources tell you where your viewers are coming from - whether it’s YouTube search, suggested videos, social media, or external websites. This insight helps you identify which platforms bring in the most engaged audience.
"The power of YouTube analytics isn't in collecting numbers. Instead, it's in transforming those numbers into decisions that move your business forward." - Sprout Social
Using Audience Retention to Find What Works
Finding High-Retention Segments in Your Videos
Your audience retention graph is like a behind-the-scenes look at what keeps your viewers hooked. You can find this data in the "Key moments for audience retention" report under the Engagement tab in YouTube Studio [12, 14].
When the graph shows flat lines, it means viewers are sticking around and watching those sections consistently. Spikes? Those indicate parts of the video that people rewatch or share - usually moments packed with humor, valuable tips, or clear explanations [13, 14]. If you see strong engagement in the first 30 seconds, that’s a good sign your title, thumbnail, and opening hook worked well.
"If the top moments are occurring in a later portion in the video, consider introducing the compelling content earlier in the video - audience sizes typically decrease over the length of the video." - YouTube Help
Once you’ve pinpointed these high-retention segments, use them as a springboard for future content ideas. For instance, if a short section on editing shortcuts grabs viewers' attention, consider turning that into a standalone video. These insights can guide you toward topics that resonate with your audience and keep them coming back for more.
After identifying what works, shift focus to the areas where viewers lose interest to refine your approach.
Learning from Drop-Off Points
Drop-offs in your retention graph tell a different story: where and why viewers tune out. The first 30 seconds are especially crucial - if more than 40% of your audience disappears during this time, it’s a clear sign your intro needs work. Common culprits include lengthy logo animations, slow starts, or failing to get to the point quickly.
Mid-video dips often highlight pacing issues, like overly detailed explanations, going off-topic, or visuals that lack variety. If you notice a sharp drop at a specific moment, take a closer look - it could be due to an abrupt topic change, poor audio quality, or something else that disrupts the flow. Drops near the end of the video might mean your outro dragged on too long or your call-to-action was too forceful, causing viewers to leave.
Use these insights to adjust your video structure. For example, if viewers frequently drop off around the 4-minute mark, try adding a visual shift or a teaser 15 seconds before that point to hold their attention. The idea is to spot patterns and tweak your content to avoid making the same mistakes.
YouTube Analytics Deep Dive Session - How to Find Video Topics and Ideas
Using Engagement and Traffic Data for New Ideas
YouTube Analytics Metrics Guide: What Each Metric Means and How to Act
Analyzing Traffic Sources and How Viewers Find You
Understanding where your viewers come from can unlock a treasure trove of content ideas. The Reach tab in YouTube Studio breaks down how people discover your videos - whether through YouTube Search, Suggested Videos, Browse Features (like the Home screen), or External sources like Reddit or Discord [4, 26].
If YouTube Search is your main traffic driver, it means viewers are actively looking for specific topics. Dive into the "YouTube search terms" report to see the exact phrases people use to find your content. These search terms can help you spot trending topics or gaps in your existing content. For example, if "budget meal prep for students" is a common search bringing viewers to your channel, you might want to create more videos around similar themes. On the other hand, if Suggested Videos generate a lot of traffic, it shows that YouTube’s algorithm is pairing your content with related videos. Analyzing these suggestions can help you refine your content strategy.
External traffic sources, like Reddit or niche forums, can also provide valuable insights. If your content is being shared on specific platforms, it’s a sign that these communities find your videos relevant. Keep an eye on these external sources to discover niche topics that could inspire your next project. Additionally, the "Research" or "Trends" tab in YouTube Studio can highlight content gaps - topics people are searching for but can’t find quality videos on [6, 11]. Filling these gaps could help you reach an audience already eager for your content.
While traffic sources reveal how viewers find your content, engagement metrics dig deeper into why they connect with it.
What Engagement Metrics Tell You About Viewer Preferences
Once you’ve identified how viewers discover your channel, engagement metrics help you understand what resonates with them. Metrics like likes, comments, shares, and subscribers gained can pinpoint the topics and formats that truly hit the mark. For instance, a video with a high like-to-view ratio shows that both the subject and its execution are striking a chord with your audience. But comments often provide the most direct feedback - viewers share their thoughts, ask questions, and suggest topics they’d like to see covered.
By regularly reviewing your comments, you can spot recurring themes or questions. For example, if viewers frequently ask about editing techniques for B-roll or lighting setups, these could be great ideas for future videos. Shares are another strong indicator of success - when people share your content, it means they find it useful, relatable, or worth recommending to others.
Sorting your videos by "Subscribers Gained" can also reveal what’s working. These "hero" videos are the ones that convert casual viewers into loyal subscribers. Creating more content around these successful topics or even turning them into a series can help grow your audience further. On the flip side, videos with high "Subscribers Lost" might indicate topics or formats that don’t align with your core audience’s interests.
"Think of your analytics as a direct line to your viewers' brains. They show you what people are watching... and even what else they're interested in." - Subscribr
sbb-itb-08cadfc
Creating Content for Your Specific Audience
Using Demographics to Shape Your Content
Understanding your audience's demographics can do more than just fine-tune your content - it can spark fresh video ideas. The Audience tab in YouTube Analytics provides a wealth of information about your viewers, including their age, gender, location, and language. This data helps you determine if your content aligns with their stage of life and interests. For instance, if a significant portion of your audience is between 18 and 24 years old, you might consider creating videos about budgeting for a first apartment, starting a career, or navigating college life.
Geographic data is another powerful tool for shaping your strategy. If a large percentage of your watch time comes from specific regions, you can adjust your content and even your upload schedule to better suit those viewers.
"If you're advertising a local product, but your videos aren't generally being viewed locally, it may be time to investigate your keywords." - Neil Patel
These insights go beyond just numbers - they provide a foundation for crafting content that resonates with your audience's specific interests.
Matching Video Ideas to Audience Interests
Demographics are just the beginning. Diving into your audience's viewing habits can take your content strategy to the next level. YouTube Analytics offers tools like "Other channels your audience watches" and "What your audience watches", which reveal related niches and formats that grab their attention. For example, if your cooking channel audience also enjoys gardening videos, this could inspire content about growing your own herbs or vegetables.
The Research tab is another valuable resource, showing the search terms your viewers have used in the last 28 days. These high-traffic keywords can be perfect for video titles, helping you address content gaps. Plus, the reports highlight external videos your audience recently engaged with, giving you insight into the themes and styles they prefer.
Getting Video Ideas with Outlier
YouTube Analytics is great for understanding how your own videos perform, but Outlier takes things a step further by analyzing what’s driving success for your competitors. While your channel’s data shows internal performance, Outlier reveals industry trends by examining competitor content. It looks at videos from the past 90 days and provides personalized video ideas, complete with suggested titles, hooks, and confidence scores - all in just 2 minutes. Best of all, you don’t need a subscription or account connection. This competitor-focused analysis complements your internal data, giving you a well-rounded approach to generating video ideas.
How Outlier Analyzes Competitor Content
Outlier zeroes in on "outlier videos" - those that perform 3× to 10× better than average - uncovering patterns that often go unnoticed. It sifts through over 50 million YouTube videos, focusing on channels with similar subscriber counts to yours.
What sets Outlier apart is its deep dive into video scripts. It doesn’t just look at surface-level metrics; it breaks scripts down to the sentence level, analyzing hooks, pacing, curiosity loops, and engagement trends. It also studies audience behavior, examining video lengths, tones, and styles to identify what resonates most.
The tool tracks growth over 30- and 90-day periods, highlighting underserved niches where demand is high but competition is low.
"OutlierKit is the first tool that actually improved our view counts almost instantly. The competition analysis revealed gaps we never knew existed."
Gautham, Multi-Channel Creator
Armed with these insights, Outlier turns data into actionable strategies that you can implement right away.
Using Outlier's Data-Backed Recommendations
Each video idea comes with an "outlier score", which estimates how likely a topic is to perform well. These scores are based on view velocity - how quickly a video gains views relative to its age. This helps you spot trending topics before they become oversaturated, a critical advantage since many videos fail due to relying on guesswork.
The recommendations go beyond generic advice. For example, instead of suggesting a broad topic like "how to start a podcast", Outlier might identify a more specific angle, such as "microphones under $50", based on high search volume and low competition. This targeted approach can help smaller channels compete more effectively and attract more views.
Outlier also breaks down competitor scripts to pinpoint where viewers lose interest, especially in the first 15–30 seconds. With this insight, you can refine your own content to keep viewers engaged from the start.
"The script analysis feature is incredible. It showed me exactly why my hooks weren't working. Fixed it, and my numbers improved dramatically."
Swapnil, Content Creator
Turning Analytics Into Video Ideas
Using YouTube analytics alongside insights from Outlier can help you craft a content strategy that's guided by data. By combining these tools, you can pinpoint and test video ideas that are more likely to resonate with your audience. This approach connects the dots between initial analytics and strategic content creation.
Choosing Ideas with the Best Potential
Start by identifying patterns in your top-performing videos. Look at metrics like Click-Through Rate (CTR) and watch time to find recurring themes - whether it's the topic, format, or presentation style. These trends become the foundation for brainstorming future content ideas. Use both your internal analytics and Outlier's external insights to validate each idea's potential.
Next, align your findings with Outlier's data. Pay close attention to ideas with high outlier scores, which suggest strong view velocity. Combine this with your audience's preferences. For instance, if your retention data shows viewers love detailed troubleshooting, and Outlier highlights a trending format focused on common mistakes, that's a signal to explore similar content.
You can also use the Views Multiplier Score to evaluate competitor videos. Divide a video's total views by the channel's average views - a score above 1.0 indicates a standout video worth analyzing. If your audience shares similar interests, like budget-friendly tips, consider creating your own spin on that concept.
Another strategy is the Transfer Method, which involves adapting successful formats from other niches. For example, if a cooking channel's myth-busting series is thriving, you could apply that structure to debunk fitness myths on your fitness channel.
Don’t overlook search trends. Use the Research tab in YouTube Studio to spot "Content Gaps" - search terms with high demand but low competition . When these gaps align with Outlier's trending topics and your retention data, you've found a strong idea to pursue.
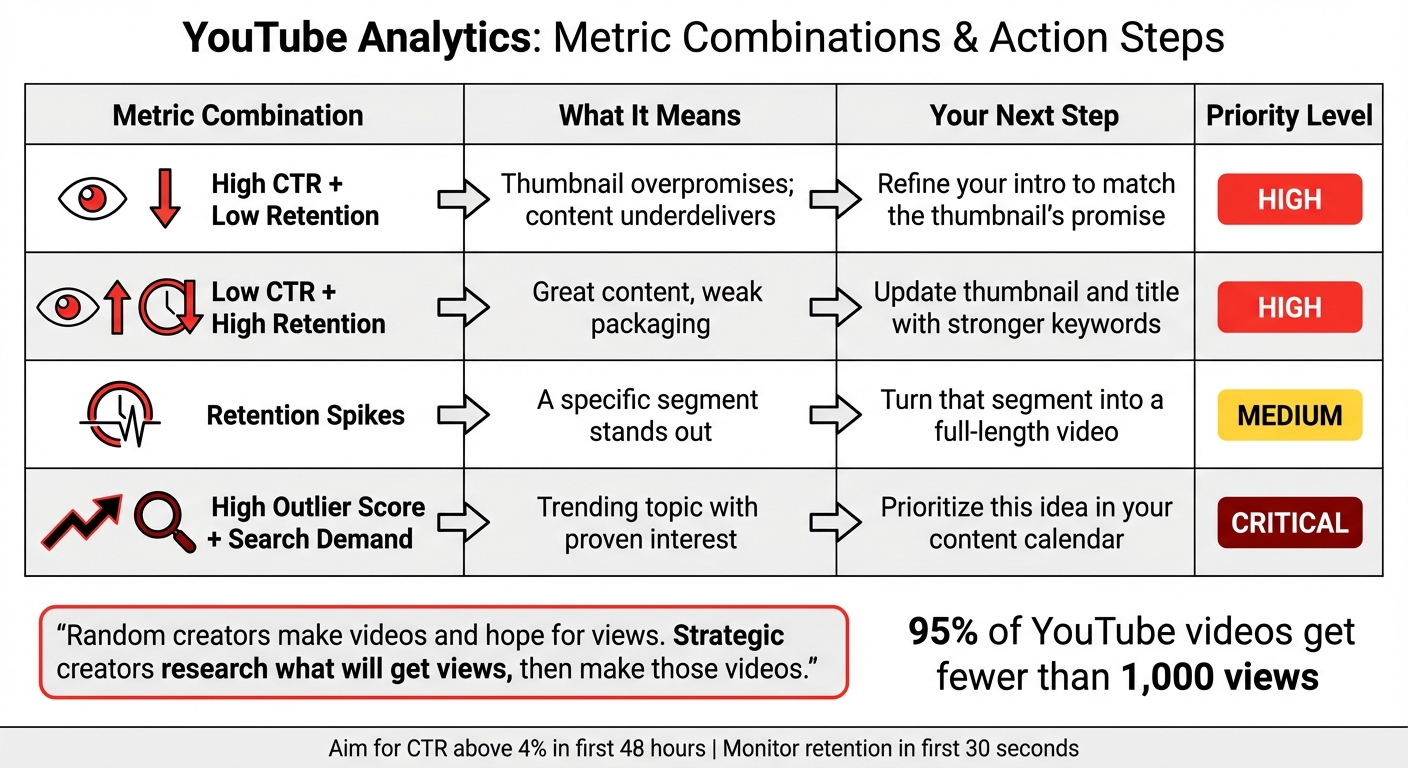
Metric Combination
What It Means
Your Next Step
High CTR + Low Retention
Thumbnail overpromises; content underdelivers
Refine your intro to match the thumbnail's promise
Low CTR + High Retention
Great content, weak packaging
Update your thumbnail and title with stronger keywords
Retention Spikes
A specific segment stands out
Turn that segment into a full-length video
High Outlier Score + Search Demand
Trending topic with proven interest
Prioritize this idea in your content calendar
"Random creators make videos and hope for views. Strategic creators research what will get views, then make those videos." - Aditi, OutlierKit
Testing and Improving Your Ideas
Once you've selected potential video ideas, test them on a smaller scale before committing to full production. Treat every video as an experiment. Start with Minimum Viable Content (MVC) - create a YouTube Short or run a community poll to gauge interest . If the Short performs well, consider expanding it into a long-form video.
After publishing, closely monitor your video's performance in the first 48 hours. Aim for a CTR above 4%. If impressions are high but clicks are low, use YouTube's "Test & Compare" feature to A/B test different thumbnails and see which one works best .
Pay extra attention to the first 30 seconds of your video. This is when most viewers decide whether to keep watching. If your retention graph shows a sharp drop-off early on, it’s a sign your hook needs improvement . Compare your intro with successful outlier videos highlighted by Outlier, and consider adopting their techniques.
Underperforming videos aren’t a lost cause. Update their titles and thumbnails with fresh keywords, but be patient - it can take up to three months for YouTube's algorithm to re-index and promote the updated content. Additionally, place calls-to-action right before known drop-off points in your retention graph to capture subscribers while engagement is still high.
Make it a habit to review your strategy regularly. With 95% of YouTube videos getting fewer than 1,000 views, a data-driven approach can significantly boost your results - sometimes by as much as 10×.
Conclusion
YouTube Analytics provides a treasure trove of insights - what your viewers watch, how long they stay, and even the search terms they use to find your content. Pairing this data with external insights from Outlier allows you to stop guessing and start creating content your audience actually wants. By blending YouTube's internal metrics with Outlier's competitor analysis, your content strategy becomes sharper and more effective. This data-driven approach turns YouTube into a predictable platform, where informed decisions can yield results far beyond what gut instinct alone can achieve. It also sheds light on why so many videos fail to perform.
A staggering 95% of YouTube videos get fewer than 1,000 views, largely because creators skip the critical research phase and dive straight into production. By analyzing retention spikes, traffic sources, and competitor trends, you can pinpoint the topics and formats that resonate most - before you even press record. Outlier speeds up this process, delivering tailored video ideas, complete with titles, hooks, and confidence scores, in just two minutes. It’s a shortcut to understanding what’s already working in your niche.
"Random creators make videos and hope for views. Strategic creators research what will get views, then make those videos." - Aditi, OutlierKit
Instead of spending countless hours creating videos that miss the mark, you can focus your time on gauging demand. Use tools like the Research tab, retention analysis, and outlier detection to identify what your audience truly wants. This approach leads to fewer wasted hours and more videos that connect with your viewers. Knowing which moments make viewers rewind and which ones cause them to drop off allows you to craft content that keeps them engaged and signals quality to YouTube’s algorithm.
Data doesn’t stifle creativity - it enhances it. By understanding your audience’s demographics, preferences, and viewing habits, you can experiment intelligently. Whether it’s trying out Shorts, A/B testing thumbnails, or adapting successful formats from related niches, you can grow your channel with intention while staying true to your unique voice.
FAQs
How can I use YouTube Analytics to come up with better video ideas?
YouTube Analytics is an incredibly useful resource for refining your video content and generating fresh ideas. To get started, establish clear goals for your videos - whether you want to increase watch time, gain more subscribers, or improve your click-through rates. Then, focus on the metrics that directly tie into these objectives.
Take a close look at Audience Retention to pinpoint where viewers lose interest or remain engaged. These insights can help you fine-tune your pacing, improve your opening hooks, or adjust segment lengths to keep people watching longer. The Audience tab is another goldmine, revealing the other channels and topics your viewers are into. Use this information to brainstorm video ideas that match their preferences.
Don’t forget to analyze your traffic sources and click-through rate (CTR). This data helps you figure out which titles, thumbnails, and tags are resonating with your audience. For a more streamlined approach, tools like Outlier can take things a step further by turning these trends into actionable suggestions. In just a few minutes, Outlier can generate data-backed ideas for titles and hooks, making it easier to deliver content your audience will genuinely enjoy.
What metrics should I focus on to analyze my video’s performance?
To understand how your video is performing, dive into these essential metrics in YouTube Analytics:
- Views: This tells you how many times your video has been watched.
- Watch time and average view duration: These metrics show how long viewers are sticking with your video. Longer watch times usually mean your content is resonating well.
- Audience retention: This highlights where viewers lose interest or stay engaged, offering clues about what’s working and what might need tweaking.
- Engagement metrics: Includes likes, comments, shares, and subscriber changes. These numbers reveal how your audience is interacting with your content and whether it’s inspiring action.
Also, keep an eye on your click-through rate (CTR) to measure how effective your thumbnail and title are at grabbing attention. Don’t forget to check your traffic sources to see where viewers are finding your content. These insights can help you refine your approach and develop more focused, data-backed video ideas.
How can audience demographics help you come up with better video ideas?
Understanding who your audience is - things like their age, gender, location, and even the devices they use - can make a big difference in creating videos that resonate. YouTube’s Audience tab is a great tool for this. It gives you a snapshot of which groups are most engaged and what kind of content they enjoy. For example, if your analytics show that most of your viewers are 18–24-year-old males in the U.S. who are into tech reviews, you can shape your topics, titles, and visuals to match their interests.
Noticing patterns in your audience’s behavior also helps you uncover content opportunities. Let’s say your analytics reveal a strong following among suburban parents. You could create videos like "DIY Home Office Hacks for Parents" or "Budget-Friendly Weekend Activities for Families" to meet their needs. Tools like Outlier can simplify this process by analyzing your channel’s demographic data and even competitor trends. They offer personalized video ideas with suggested titles, hooks, and confidence scores, making it easier to turn these insights into content your audience will love.


