
Top Metrics for Updating YouTube Content Schedules
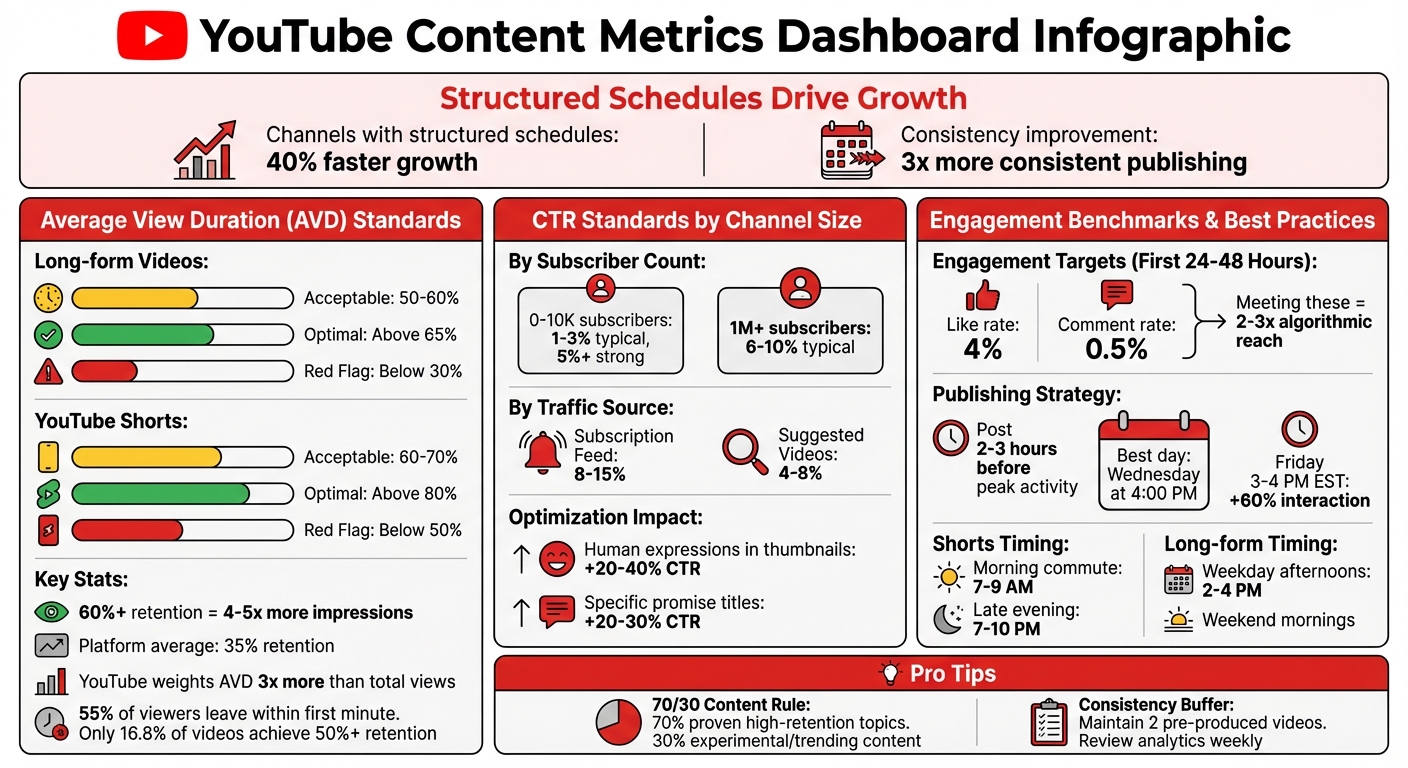
Want to grow your YouTube channel faster? The key lies in using the right metrics to guide your content schedule. Channels with structured schedules grow 40% faster and publish 3x more consistently. Here's what you need to focus on:
- Watch Time & Average View Duration (AVD): Videos with higher retention rates (60%+) get 4–5x more impressions.
- Audience Retention Curve: Identify drop-off points and high-engagement moments to refine your content.
- Click-Through Rate (CTR): A strong CTR (5%+) in the first 48 hours boosts video visibility.
- Real-Time Metrics: Track performance in the first 48 hours to adjust thumbnails or titles.
- Best Publishing Times: Use YouTube's heatmap to post 2–3 hours before peak activity.
- Engagement Signals: Likes, comments, and shares influence how widely YouTube promotes your video.
- Session Duration: Videos that keep viewers on the platform longer gain more recommendations.
Pro Tip: Build a buffer of two pre-produced videos to maintain consistency and review analytics weekly to spot trends. Use these metrics to align your schedule with audience preferences, and watch your channel grow.
YouTube Content Metrics: Benchmarks and Performance Standards
YouTube Analytics Explained | What Your Data is Telling You!
sbb-itb-08cadfc
1. Watch Time and Average View Duration
Watch time tracks the total minutes your videos are viewed, while average view duration (AVD) measures the percentage of each video that viewers actually watch. Interestingly, YouTube’s algorithm now places about three times more weight on AVD compared to total views.
For example, a 10-minute video with a 70% retention rate will rank higher than a 30-minute video with only 26.7% retention. Channels achieving 60% or higher retention rates often see 4–5 times more impressions than those hovering around the platform average of 35%. This means your content strategy should focus on keeping viewers engaged rather than simply creating longer videos.
How It Impacts YouTube's Algorithm
YouTube has shifted its focus from total watch time to viewer satisfaction. Now, a shorter video with strong engagement and retention can outperform a longer one with weaker metrics. The platform measures satisfaction through viewer behavior after watching (e.g., likes, shares, and comments) and even surveys. This makes AVD a key metric for understanding if your content meets audience expectations.
"If you're still optimizing for views in 2026, you're playing last year's game with this year's rules." – DEV Community
Take Rebecca Zamolo as an example. She increased her channel’s reach by 340% by focusing on retention hooks instead of clickbait. By treating the first 30 seconds of her videos like a movie trailer, she significantly reduced early drop-offs. This signaled to the algorithm that her videos were worth promoting more widely.
Tips for Using AVD to Plan Content
Leverage AVD insights to identify evergreen topics - those that consistently deliver high retention and attract search traffic - and prioritize them in your content schedule. If your analytics show a drop in retention after the first 25 seconds, adjust future videos to highlight key moments right at the start.
Try the 70/30 approach: dedicate 70% of your uploads to proven high-retention topics and use the remaining 30% to experiment with new trends. Review the first 30 seconds of your retention graph in YouTube Studio. If you see a sharp decline, focus on creating stronger opening hooks to keep viewers engaged.
For long-form content, aim for an AVD of 50–60%, with anything above 65% being ideal. For YouTube Shorts, strive for a watch-through rate of 70% or higher, with rates above 80% being exceptional. Use these benchmarks to fine-tune the length and format of your videos.
Content Type
Acceptable
Optimal
Red Flag
Long-form videos
50–60%
Above 65%
Below 30%
YouTube Shorts
60–70%
Above 80%
Below 50%
Finally, dive into your audience retention curve to further refine your strategy and ensure your content keeps viewers hooked.
2. Audience Retention Curve Analysis
The audience retention curve provides a detailed snapshot of how viewers interact with your videos, showing exactly when they stay engaged and when they drop off.
In YouTube Studio, this curve charts viewer percentages over time, helping you pinpoint moments of high engagement and sudden declines .
Relevance to YouTube Algorithm Performance
As of 2026, YouTube's algorithm uses the retention curve to evaluate whether your content is worth promoting. Videos that retain over 65% of viewers after the first minute tend to achieve a 58% higher average view duration. Even more compelling, increasing your average retention rate across your channel by just 10 percentage points can lead to over 25% more impressions from YouTube’s recommendation system.
"The cool thing about YouTube is they give us super detailed graphs for every video that show the exact second we lose a viewer." – MrBeast
A gradual decline in the curve indicates strong viewer engagement, while sharp drop-offs in the first 30 seconds suggest that your hook or thumbnail might not be delivering on its promise . Sudden dips in the middle - known as mid-video valleys - point to pacing issues, such as unnecessary tangents or a loss of energy. Any drop exceeding 4% is a clear signal that adjustments are needed.
Impact on Viewer Engagement and Retention
The retention curve highlights both challenges and opportunities. Spikes in the graph often indicate moments where viewers rewatch or replay a segment, signaling peak engagement that you can replicate in future content . Flat sections in the curve suggest that viewers are no longer deciding to leave, which can be a positive sign of steady engagement. However, the numbers reveal a tough reality: over 55% of viewers typically leave within the first minute, and only 16.8% of videos achieve an average retention rate above 50%.
Graph Shape
What It Signals
Actionable Insight
Gentle, steady decline
Strong engagement overall
Focus on smoothing out individual dips to maintain consistency.
Steep early drop (first 30s)
Weak hook or mismatched thumbnail
Rework your intro and ensure your thumbnail aligns with the content.
Mid-video valley
Pacing or energy issues
Edit out weaker sections or add engaging elements.
Upward spikes
Replays or high interest moments
Identify these highlights and create more content around them .
These insights can directly shape your content strategy, helping you refine your approach to keep viewers engaged.
Actionable Insights for Content Scheduling
Retention curve analysis, when combined with watch time and click-through rate (CTR) data, offers a powerful tool for planning your content. By reviewing data from your last 10–20 videos, you can identify patterns in drop-off points and compile a "Spike Library" of moments that consistently drive rewatches. These high-engagement moments can guide your future content topics and structure.
For instance, if viewers frequently leave around a certain timestamp - like 20 seconds - it may be worth shortening your videos to improve completion rates. Similarly, retention data can help you prioritize topics that consistently hold attention while experimenting with new ideas. Monthly reviews of retention data can uncover "evergreen" content that maintains strong engagement over time, ensuring these topics are prioritized in your schedule.
If your retention curve shows steep drops - such as retention falling below 70% within the first 3 seconds - adjust your hook in the next video to better align with your thumbnail's promise . These small but strategic tweaks can make a big difference in keeping your audience engaged.
3. Click-Through Rate (CTR)
Click-Through Rate (CTR) reflects the percentage of times your video thumbnail successfully turns an impression into a view. Alongside metrics like watch time and audience retention, CTR plays a key role in shaping a data-driven content strategy. It’s a critical indicator of whether your video is likely to gain traction with YouTube’s algorithm. A skipped thumbnail means a missed chance to grab a viewer’s attention.
Relevance to YouTube Algorithm Performance
In 2026, a strong CTR during the first 48 hours of a video’s release significantly boosts its chances of being promoted. This metric signals relevance to YouTube’s algorithm, which interprets a high CTR as evidence that your content resonates with viewers. As a result, the algorithm increases the video’s impressions.
"CTR is YouTube's #1 signal for video promotion - higher CTR means exponentially more impressions" – InstantViews
However, CTR isn’t the whole story. For instance, a video with a CTR above 10% but a low average view duration (e.g., 15%) might be flagged as clickbait. Over time, YouTube’s algorithm may suppress such content. The key is to balance a high CTR with strong viewer retention to prove your video delivers on its promise.
CTR benchmarks vary depending on the size of your channel. For smaller creators with 0–10,000 subscribers, a CTR of 1–3% is common, while 5% or higher is considered strong. Larger channels with over 1 million subscribers often achieve CTRs between 6–10%. Traffic sources also affect CTR: videos in the Subscription Feed typically see rates between 8–15%, while Suggested Videos average around 4–8%.
Impact on Viewer Engagement and Retention
CTR tends to follow predictable patterns. It often starts high when a video is first shown to loyal subscribers, then gradually declines as YouTube introduces it to a broader audience. This decline is normal and reflects healthy reach expansion. However, sharp drops in CTR may signal underlying issues that need attention.
Seasonal trends also influence CTR. Peaks often occur in March–May, September–October, and November–December. If you notice a 1–2 percentage point drop in CTR shortly after uploading a new video, consider whether it aligns with a time of lower audience activity.
Thumbnail design plays a big role in boosting CTR. Thumbnails featuring clear human expressions can increase CTR by 20–40%. Similarly, titles that make specific promises - like "3 Steps to X" or "$500 in 7 Days" - can boost CTR by 20–30% compared to more generic titles. These design elements can make your content stand out and attract more clicks.
Actionable Insights for Content Scheduling
To maximize CTR and improve visibility, analyze your top-performing videos in YouTube Studio. Look for common themes in thumbnails, titles, or other visual elements, and use these findings to refine your style guide.
Plan your most important content releases during seasonal peaks, such as March–May or September–October, when overall CTR on the platform tends to rise. Also, make use of the "When your viewers are online" report in the Audience tab to time your uploads during peak activity hours.
For older videos with CTRs below your channel average (despite having 10,000+ impressions), consider updating their thumbnails. YouTube often re-evaluates videos when their visual packaging changes, offering a chance to revive underperforming content. Use YouTube’s native A/B testing tool to experiment with new thumbnail designs over 7–14 days or until reaching at least 2,000 impressions. This can help identify the most effective design.
4. Real-Time Performance Metrics
Real-time analytics offer a closer look at how viewers are interacting with your video immediately after it goes live. These metrics include live view counts, engagement indicators like likes and comments, and geographic data that shows where your audience is located. This data is crucial during the first 48 hours after release, a period when YouTube's algorithm determines how widely to promote your content.
Relevance to YouTube Algorithm Performance
By 2026, YouTube's algorithm prioritizes Viewer Satisfaction Scores over raw watch time. These scores are influenced by post-watch surveys, likes, and whether viewers return to your channel. Real-time analytics allow you to see if your video is resonating with its intended audience during this critical window. The algorithm also evaluates session contribution, which measures whether your video encourages viewers to continue watching more content or, conversely, causes them to leave the platform. Videos that disrupt viewing sessions may face reduced recommendations.
Another key factor in 2026 is new viewer attraction, which tracks how well your video appeals to non-subscribers. This metric influences your visibility in the Browse feed. If real-time data shows weak performance in this area, it may be time to tweak your content to reach a broader audience.
Impact on Viewer Engagement and Retention
Geographic and device data can help you optimize when and how you release content. For instance, noticing spikes in specific regions can guide your upload schedule, while understanding platform preferences (mobile vs. desktop) can shape your content format - whether short-form or more detailed videos. Real-time sentiment analysis of comments offers immediate feedback on whether your video is meeting viewer expectations, giving you a chance to refine your approach for upcoming uploads. By 2026, about 20 million creators are using "Ask Studio AI" to determine the best upload times based on audience behavior patterns.
Actionable Insights for Content Scheduling
Keep a close eye on your real-time CTR during the first 48 hours. If it’s underperforming, use YouTube Studio's "Test & Compare" feature to experiment with new thumbnails. Identify outlier videos - those performing 3x to 10x better than your channel’s average - to uncover trending topics or formats that the algorithm is currently favoring. This insight can help you adjust your content strategy to capitalize on trending themes.
Use the "Videos Growing Your Audience" report to find "gateway" videos that attract new viewers. Follow up with related content to deepen viewer engagement and extend their session time. Maintaining a consistent upload schedule is also crucial. For example, posting three videos per week on a predictable timeline tends to perform better than releasing seven videos in one week and then going silent. Aligning these real-time insights with your broader metrics allows you to make smarter, more timely adjustments to your content calendar.
5. Audience Activity Patterns and Best Publishing Times
Just like retention rates and click-through rates (CTR) shape your content strategy, understanding when your audience is most active can fine-tune your publishing schedule. YouTube Studio provides a heatmap under Analytics > Audience > "When your viewers are on YouTube". This tool highlights when your subscribers are online, with dark purple blocks indicating peak activity and lighter shades showing lower traffic levels.
Relevance to YouTube Algorithm Performance
Timing plays a critical role in your video's initial momentum. The speed at which your video gathers views and engagement shortly after being published - known as initial velocity - is a key factor. YouTube starts by showing your content to a small group of your most loyal "Day-One" fans. If this group reacts positively, the platform extends the reach to casual viewers and lookalike audiences. Publishing your video 2–3 hours before peak activity ensures YouTube has enough time to process, index, and notify viewers, helping you build early traction.
"Timing matters because of initial velocity. If your core viewers aren't active when the video goes live, the test pool shrinks." – Iryna Avramenko, ScaleLab
For instance, a gaming channel partnered with ScaleLab in early 2026 and adjusted its upload time from 12:00 PM to 4:30 PM to align with a 7:00 PM peak. Over two months, they saw a 32% increase in impressions and a 41% boost in suggested traffic - all without changing their content.
Impact on Viewer Engagement and Retention
Posting at the right time can significantly improve engagement. For example, uploading during the "afternoon slump" (2:00 PM to 4:00 PM) on weekdays can lead to 30–50% more views in the first 24 hours. Similarly, Friday uploads between 3:00 PM and 4:00 PM EST often see up to 60% higher interaction rates.
The type of content also matters. Shorts perform best during quick-scroll windows, like morning commutes (7:00 AM to 9:00 AM) or late evenings (7:00 PM to 10:00 PM). In contrast, long-form videos thrive during times when viewers can dedicate more attention, such as evenings or weekend mornings.
Using these insights, you can experiment with different time slots to optimize your publishing schedule.
Actionable Insights for Content Scheduling
To find your ideal publishing time:
- Test a single time slot for four weeks while keeping titles and thumbnails consistent.
- If your audience spans multiple time zones, prioritize the region with the highest subscriber density or the most lucrative revenue per mille (RPM).
- Monitor key metrics like "Views in the First Hour" and "CTR in the First 24 Hours" to gauge how well your chosen time captures early momentum.
This data-driven approach can help you maximize your video's reach during those all-important early hours.
6. Engagement Signals: Likes, Comments, and Shares
When it comes to performance metrics that shape your upload schedule, engagement signals - likes, comments, and shares - are a direct reflection of how satisfied your audience is with your content. Since 2025–2026, YouTube has leaned into a "viewer satisfaction–based ranking" system, prioritizing how viewers feel about your videos over just how long they watch them. This shift makes tracking these signals a must when deciding when to post.
Relevance to YouTube Algorithm Performance
Not all engagement signals are created equal. Shares stand out as the strongest indicator of content approval because they show viewers are willing to endorse your video to others. Comments come next, as they require more effort and thought from viewers. Likes, while still valuable, are considered a more casual nod of approval. On top of this, YouTube's algorithm digs deeper by analyzing the tone of comments using sentiment modeling. Positive comments can help boost your video's visibility, while negative ones might have the opposite effect.
"We're trying to understand not just about the viewer's behavior and what they do, but how they feel about the time they're spending" – Todd Beaupré, Senior Director of Growth and Discovery at YouTube
This means early engagement doesn’t just help the algorithm - it also sets the tone for how viewers will interact with your video moving forward.
Impact on Viewer Engagement and Retention
The first 24–48 hours after your video goes live are critical. During this time, YouTube measures engagement velocity - the speed at which likes, comments, and shares are piling up - to decide how far to push your video. Videos that hit a 4% like rate and a 0.5% comment rate during this window often see their reach double or even triple through algorithmic promotion. For Shorts, these benchmarks are just as crucial. Early engagement from your core audience can give your video a major boost, which is why timing matters. Publishing your video 2–3 hours before your audience's peak activity ensures YouTube has time to process these signals.
Actionable Insights for Content Scheduling
Leverage YouTube Studio Analytics to pinpoint the best time to upload. Aim to post around 2 hours before the darkest purple blocks on your heatmap - these represent your audience's peak activity. Keep an eye on your early "likes-per-view" ratio as a quick indicator of engagement. For instance, if a video achieves a 3% ratio on a channel that typically averages 0.8%, it’s a strong signal for the algorithm to amplify its reach. Hosting premieres during these optimal time slots can also drive engagement through live chat. To encourage more comments, try posing direct questions or sharing a bold opinion that sparks discussion. By combining these strategies with other performance metrics, you can fine-tune your posting schedule for maximum impact.
7. Session Duration
Session duration adds another layer to metrics like watch time, retention, and CTR, offering insights into how your videos influence overall viewer behavior on YouTube.
This metric tracks the total time a viewer spends on YouTube during a single visit, including views of videos beyond your own. It’s an important factor because YouTube’s algorithm favors videos that either kick off a viewing session or keep viewers engaged longer on the platform. These videos generate more ad impressions, making them more valuable to YouTube. On the other hand, videos that cause viewers to leave the platform are less likely to appear in Suggested and Browse feeds.
Relevance to YouTube Algorithm Performance
Session contribution plays a critical role in how often your videos are promoted in Suggested and Autoplay feeds under the 2026 algorithm. The algorithm evaluates whether viewers continue watching more content after your video or leave the platform entirely. Videos that rank in the top 20% for watch time and retention gain 5-10x more algorithmic impressions compared to those in the middle range. YouTube uses signals like audience retention, average views per viewer, and end-screen click-through rates to estimate how well your video contributes to longer sessions. Since the platform shifted its focus to "viewer satisfaction" in 2026, creating content that encourages viewers to stay engaged with multiple videos has become key to sustained growth.
Impact on Viewer Engagement and Retention
The first 30 seconds of your video are make-or-break. If viewers leave during this critical window, the algorithm is less likely to recommend your video. Only about one in six videos manage to keep more than 50% of viewers watching until the end. A high session duration signals that your channel provides value, increasing the likelihood that casual viewers turn into loyal subscribers who return for more content. Videos that encourage viewers to watch additional content also gain more visibility in recommendations, creating a compounding effect that boosts your channel’s reach.
These insights underline the importance of creating content that not only captivates viewers but also encourages them to stay on YouTube longer.
Actionable Insights for Content Scheduling
To maximize session duration, structure your content calendar around topic clusters or series that naturally lead to binge-watching. Group related videos into playlists with consistent titles and thumbnails to make it clear they belong together. Apply the 70/30 rule with session extension in mind: focus 70% of your uploads on core topics that encourage extended viewing, and use the remaining 30% for trend-driven content.
End each video with a strong "hand-off" strategy - summarize the key takeaway and direct viewers to a related video or playlist in the last 10-15 seconds. Instead of driving traffic to external links, use end screens and playlists to keep viewers engaged on the platform. Organize playlists strategically, starting with videos that are beginner-friendly or have high satisfaction rates to hook viewers into longer sessions.
Using Data to Make Scheduling Decisions
Tracking metrics is just the starting point; the real value comes from using those insights to shape your scheduling strategy. Begin by reviewing your videos sorted by total watch time. Pinpoint your top three performers and study their shared traits - things like thumbnail design, title wording, hook delivery, video length, and traffic sources. These elements form the "winning formula" you can apply to future content planning.
Once you've nailed down your best-performing videos, focus on refining your upload timing. Try a 4-week A/B test to discover the best publishing window. Stick to one time slot for 4–6 uploads, then adjust by 90 minutes and compare metrics like "Views in the First Hour" and "24-Hour CTR". A good rule of thumb? Post 2–3 hours before peak activity. This gives the platform time to process metadata and send out notifications right as engagement spikes. Data from 1 million videos suggests that Wednesday at 4:00 PM sees the highest median views, while Fridays between 3:00 PM and 4:00 PM EST can generate up to 60% higher interaction rates.
When planning your schedule, apply the 70/30 rule: dedicate 70% of your uploads to core topics that encourage regular viewership, and use the remaining 30% for reactive, trending content that prioritizes immediate relevance over the calendar. Channels with a clear content schedule are 3x more consistent and grow their subscriber base 40% faster over a year.
If you're targeting a global audience, use YouTube Studio's "When your viewers are on YouTube" report to identify overlapping activity windows. For example, posting between 12:00 PM and 2:00 PM EST can simultaneously capture the US afternoon, European evening, and Asian late-night audiences. For international channels, focus on the time zone with the highest Revenue Per Mille (RPM) or the densest subscriber base. Content type also plays a role: Shorts perform well during "scroll windows" like morning commutes (7:00 AM – 9:00 AM) and late-night browsing (7:00 PM – 10:00 PM), while long-form videos thrive during longer viewing periods, such as weekday afternoons (2:00 PM – 4:00 PM) or weekend mornings.
After setting your global schedule, track the impact of your adjustments regularly. Align weekly tracking efforts with your data-driven calendar updates. Monitor metrics like watch time, AVD, CTR, and impressions every week to spot 12-week trends before making major changes. Test one variable at a time - video length, hook style, or posting time - and experiment with a small batch before rolling out changes. If you notice a CTR difference of more than 2 percentage points between similar videos, immediately adopt the more effective thumbnail style for upcoming content.
Conclusion
YouTube Analytics is like a compass for channel growth. The metrics we've covered - such as watch time, retention curves, CTR, and engagement - offer the insights you need to move beyond simply uploading content and toward a more thoughtful, data-driven approach.
Data backs this up: channels with a well-documented content schedule grow faster. By conducting weekly analytics reviews and monthly audits, you create a feedback loop that helps you fine-tune your strategy. Plus, subscribers tend to watch twice as much video as non-subscribers, making every scheduling decision a chance to strengthen audience loyalty.
Make it a habit to review your top and bottom 20% of performing videos each month. Look for patterns in video formats, upload timing, and packaging that you can either replicate or avoid. Retention graphs can be your secret weapon - pinpoint where viewers lose interest and adjust future content accordingly. Align your schedule with peak audience activity, keep a two-video buffer ready, and balance your content mix with 70% core topics and 30% trending ideas. This creates a framework for consistent and manageable growth.
Regular reviews of your analytics also ensure you're in sync with YouTube’s algorithm, which favors high watch time and steady upload schedules. These insights directly influence your content calendar and help you make smarter adjustments.
Take action today: log into YouTube Studio and check the "When your viewers are on YouTube" report. That one piece of data can transform how you plan your uploads. Use these tools to refine your strategy and set your channel on a trajectory for lasting growth.
FAQs
Which metrics matter most for deciding what to post next?
The key metrics to keep an eye on are click-through rate (CTR) and audience retention. CTR tells you how well your thumbnail and title are grabbing attention, while audience retention shows where viewers start dropping off. These numbers are essential for understanding how your content performs and can guide you in making smarter decisions for future posts.
How do I fix low CTR without hurting retention?
To boost a low CTR without sacrificing retention, put your energy into refining thumbnails and titles. Design thumbnails that grab attention with bold colors, strong contrast, and clear, engaging visuals or text. For titles, aim to spark curiosity or emphasize the value your video offers. Experiment with different thumbnail and title combinations using tools like YouTube Studio's 'Test & Compare' feature. This way, you can discover what clicks with your audience while keeping your content aligned and engaging to sustain retention.
How often should I change my upload schedule based on analytics?
To make the most of your content, tweak your upload schedule based on your channel's analytics. Pay close attention to when your audience is most active, and adjust your posting times accordingly. It’s a good idea to revisit and update your schedule every few weeks or whenever you notice a clear change in viewer behavior. Keeping an eye on metrics like watch time and engagement will ensure you’re staying in sync with what your audience wants.


